
Monthly and Annual Weight Reports: See Your Progress Month by Month
Learn how to use Reports in Scaler to look back at every month and year of your weight loss. See your change, average, lowest and highest weigh-ins, a trend chart, your BMI and your check-in streak in one place.

Day to day, your weight goes up and down for all sorts of reasons: water, salt, a late dinner or a hard workout. Looking at a single weigh-in rarely tells you much. Looking at a whole month does. Reports in Scaler group your weigh-ins by month and year, so you can see how far you’ve come, compare one month with another and spot the habits behind your best results.
Each report is built automatically from your weigh-ins. There is nothing to set up: keep logging your weight, and a new report appears for every month and year you track.
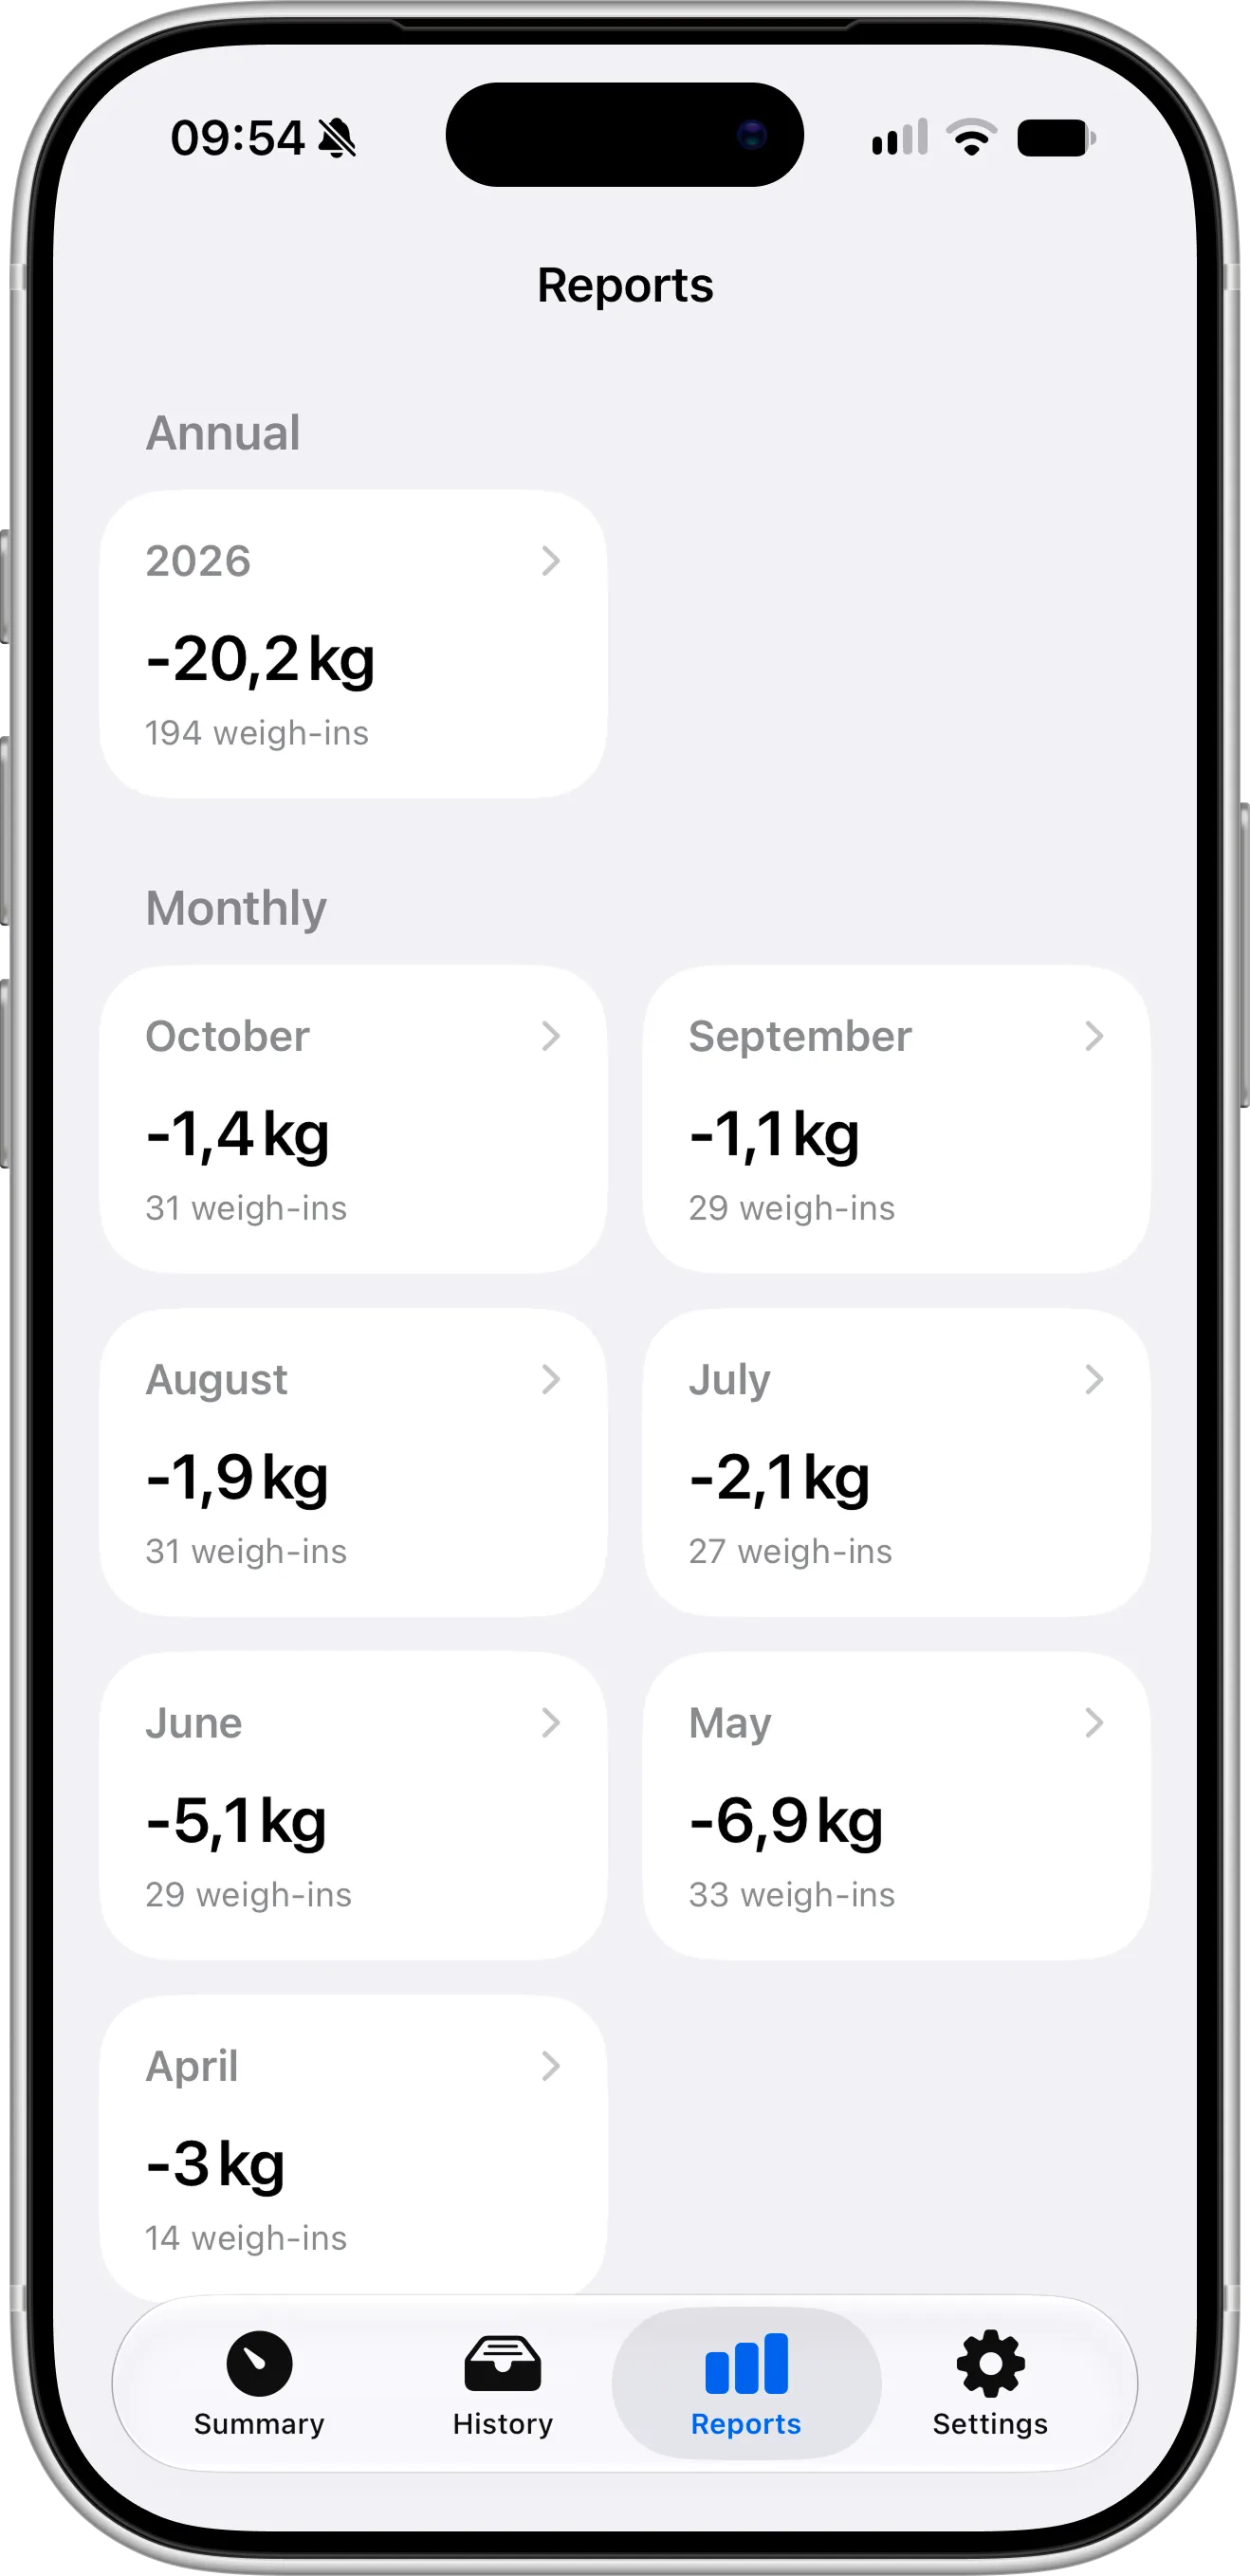
The Reports tab: every year and month at a glance, with your weight change and the number of weigh-ins for each.
What You Need Before Getting Started
To use Reports, you first need to download and install the Scaler weight loss tracker from the App Store. Reports work on both iPhone and iPad.
The report for the current month is free for everyone. Reports for past months, every annual report and the extra Weight Distribution and Weigh-In Time charts are included in Pro.
For the most complete report, set your height in Settings so it can show your BMI.
How To Open a Report
- Open the Reports tab.
- Find your year under Annual, or a month under Monthly. Each card shows how much your weight changed and how many times you weighed in.
- Tap a card to open the full report.
The newest month is always at the top, so the report you’re most likely to check is the first one you see.
Get Notified When Your Report Is Ready
You don’t need to remember to check your report. On the 1st of each month, Scaler sends you a notification that last month’s report is ready. Tap it to open the report right away. Reports for past months are included in Pro.
You get this notification if you’ve allowed notifications for Scaler (for example, when you turned on weigh-in reminders) and you logged at least one weigh-in last month. Tapping a weigh-in reminder takes you straight to adding a new weigh-in, so keeping your next report complete only takes a few seconds.
What’s in a Monthly Report
A monthly report starts with four key numbers:
- Change: how much your weight changed since your first weigh-in of the month.
- Average: your average weight for the month and how many weigh-ins it’s based on.
- Lowest and Highest: your lightest and heaviest weigh-ins, with their dates.
Below them, the weight chart shows how your weight moved through the month, so you can see the overall direction behind the daily ups and downs.
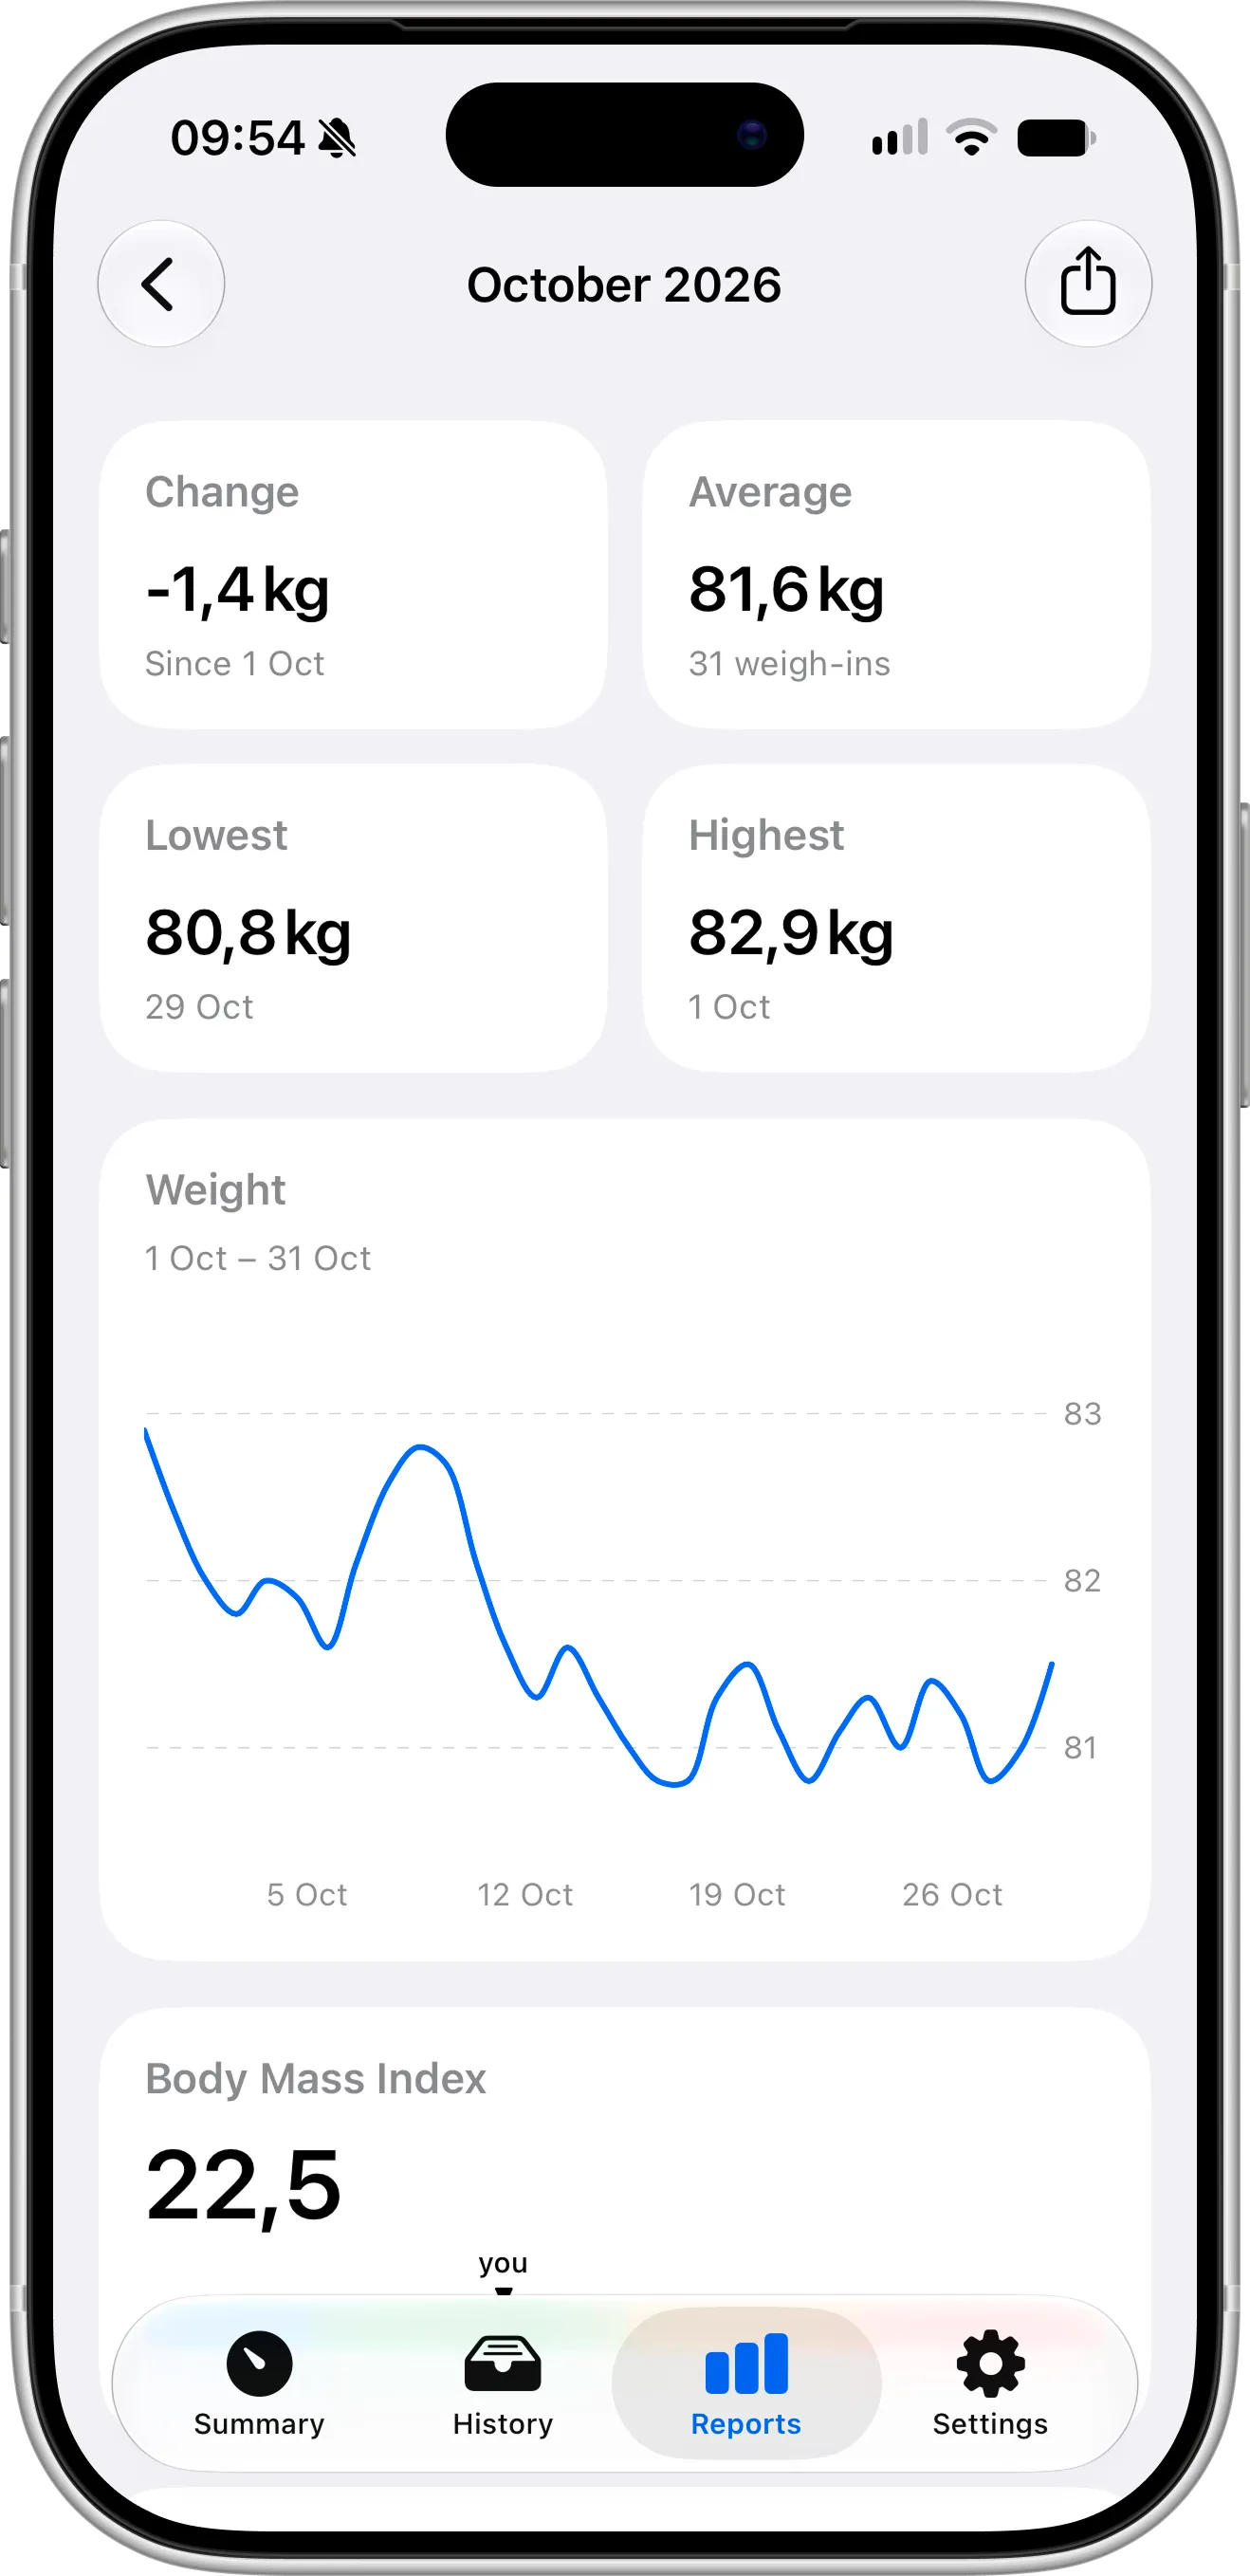
The top of a monthly report: your change, average, lowest and highest weight, plus a chart of the whole month.
Next comes your Body Mass Index, shown on a colored scale so you can see which range you’re in at the end of the month.
With Pro, the report also includes Weight Distribution, which shows how many days you spent at each weight. A tall bar means that’s where your weight settled most often, which is a calmer way to see your real weight than any single weigh-in.
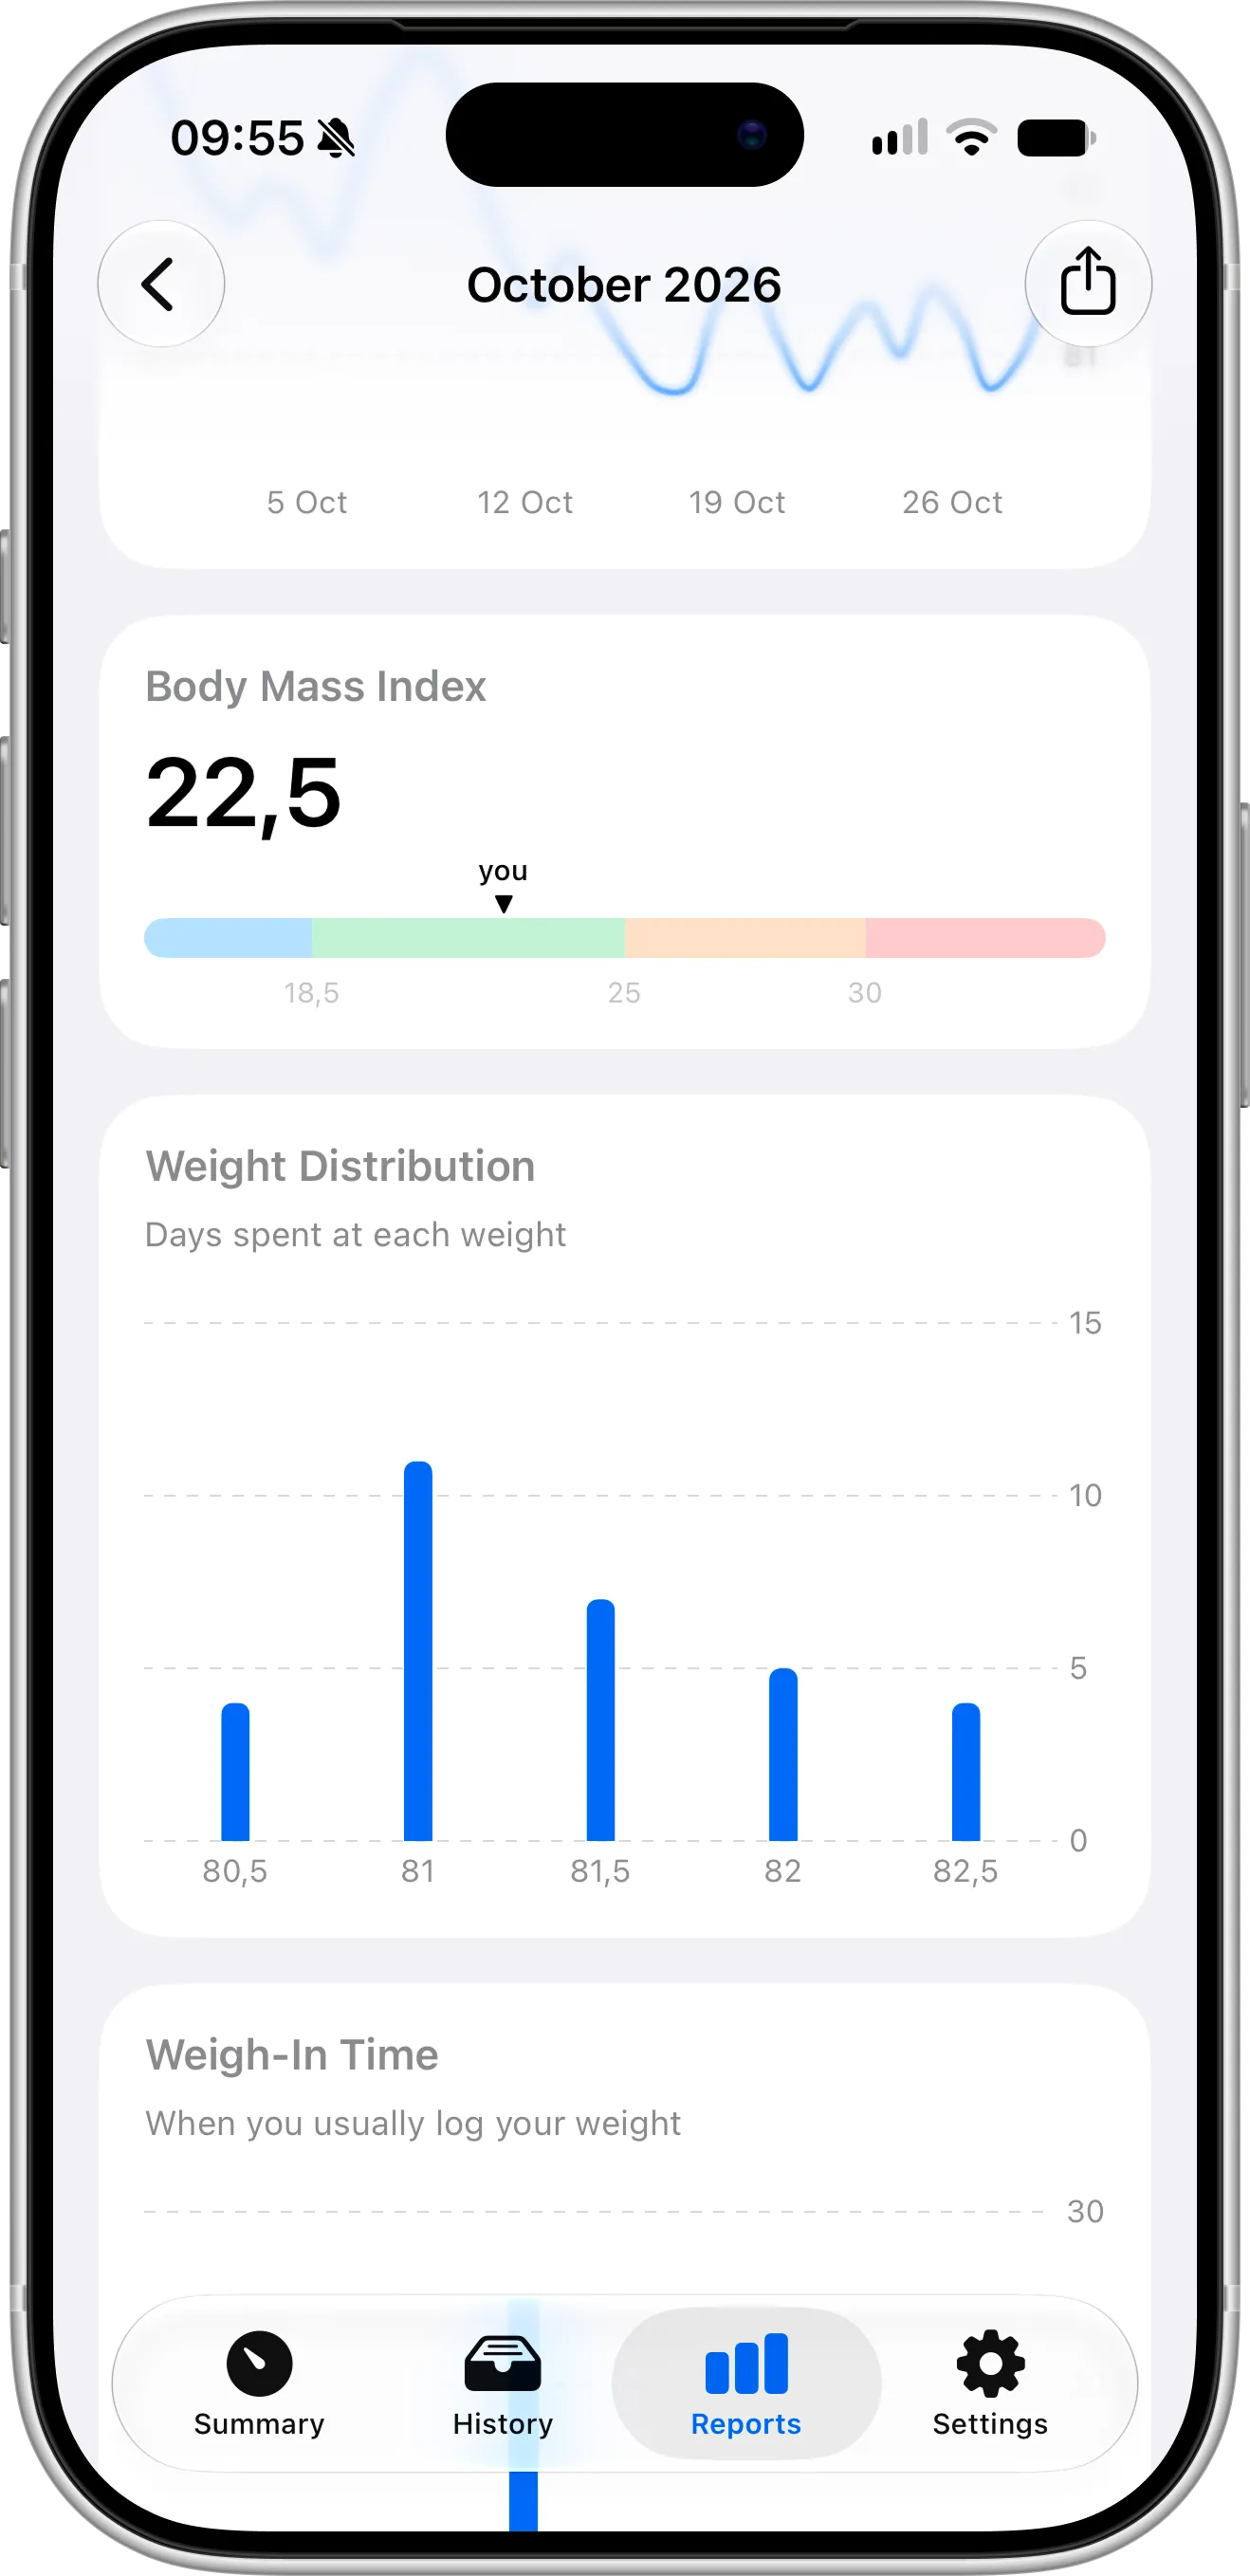
Your BMI at the end of the month, and with Pro, how many days you spent at each weight.
The Weigh-In Time chart, also in Pro, shows when you usually log your weight. Weighing in at the same time each day makes your numbers much easier to compare, and this chart shows you how consistent you’ve been.
The Daily Check-In card shows how many days of the month you logged your weight, with a mark for each day, so missed days are easy to spot.
At the bottom, Weigh-ins opens a list of every entry from the month, with the change from the previous weigh-in.
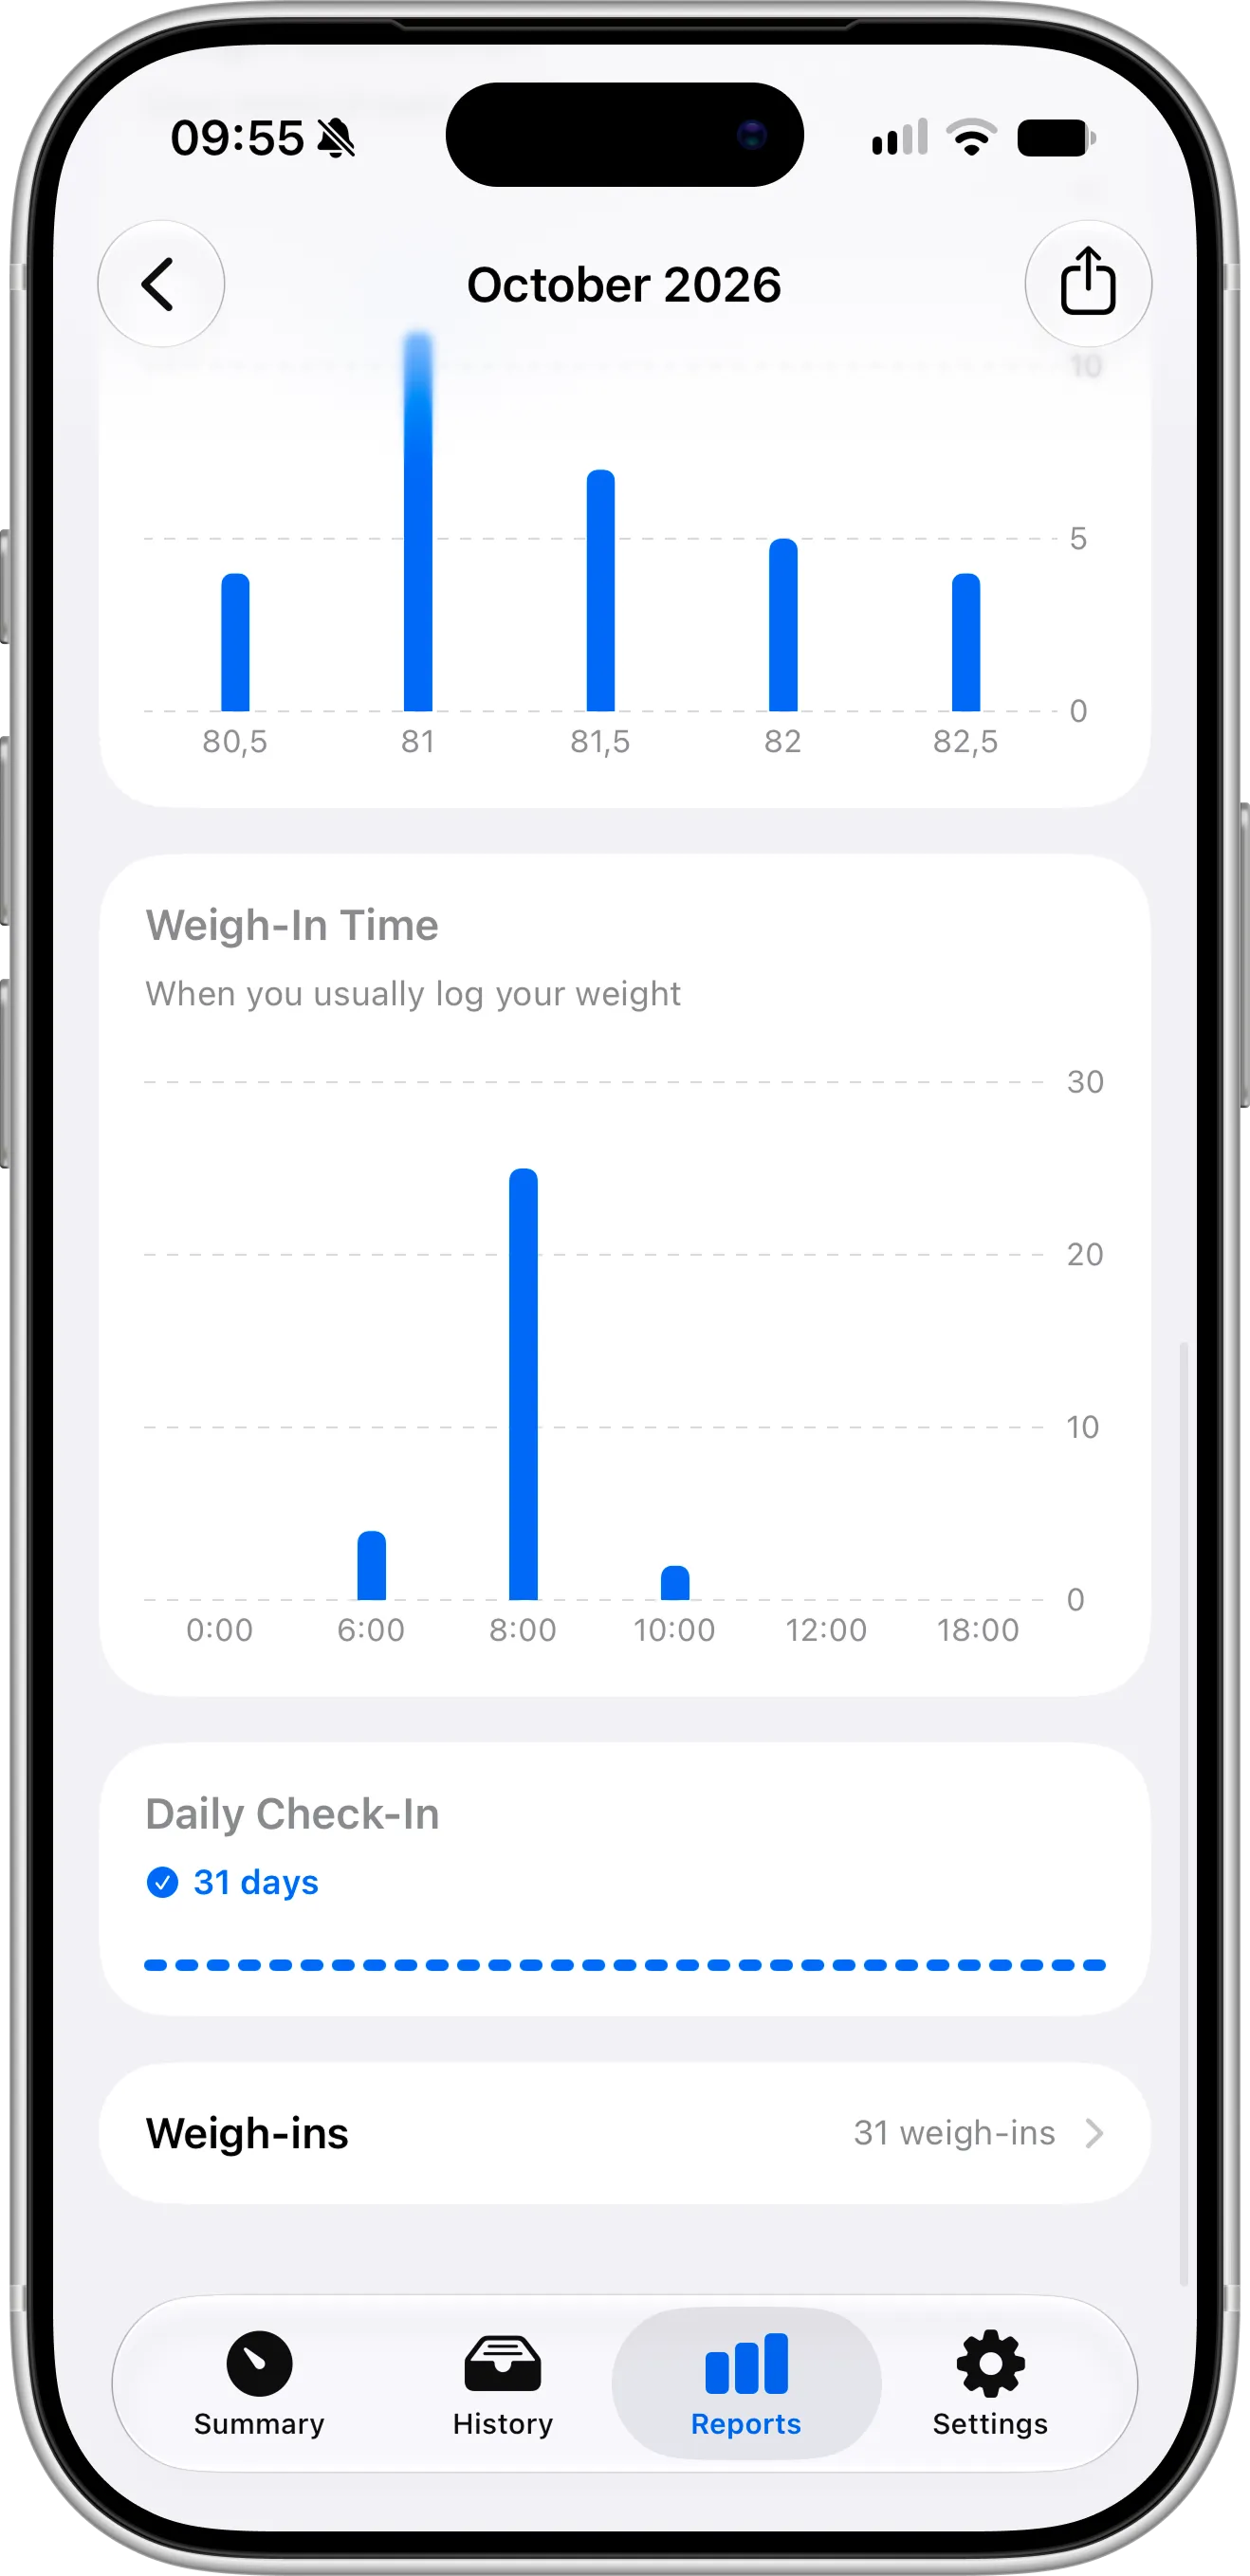
When you usually weigh in, how many days you checked in and every weigh-in from the month, at the end of the report.
What’s in an Annual Report
An annual report, available in Pro, gives you the same view for a whole year: your total change, average, lowest and highest weigh-ins, a chart of the whole year, your BMI, the Weight Distribution and Weigh-In Time charts, and every weigh-in. It’s the best way to look back at a full year of progress, especially when the changes from month to month feel small.
Share or Export a Report
Tap the share button in the top-right corner of any report to share that month or year. You can choose from these formats:
- Image: a progress image for Stories or posts, with your result for the period.
- CSV and JSON: the period’s weigh-ins as a file, free for everyone.
- PDF: a printable report for your doctor, in Pro. See how to export a PDF weight report for what’s inside.
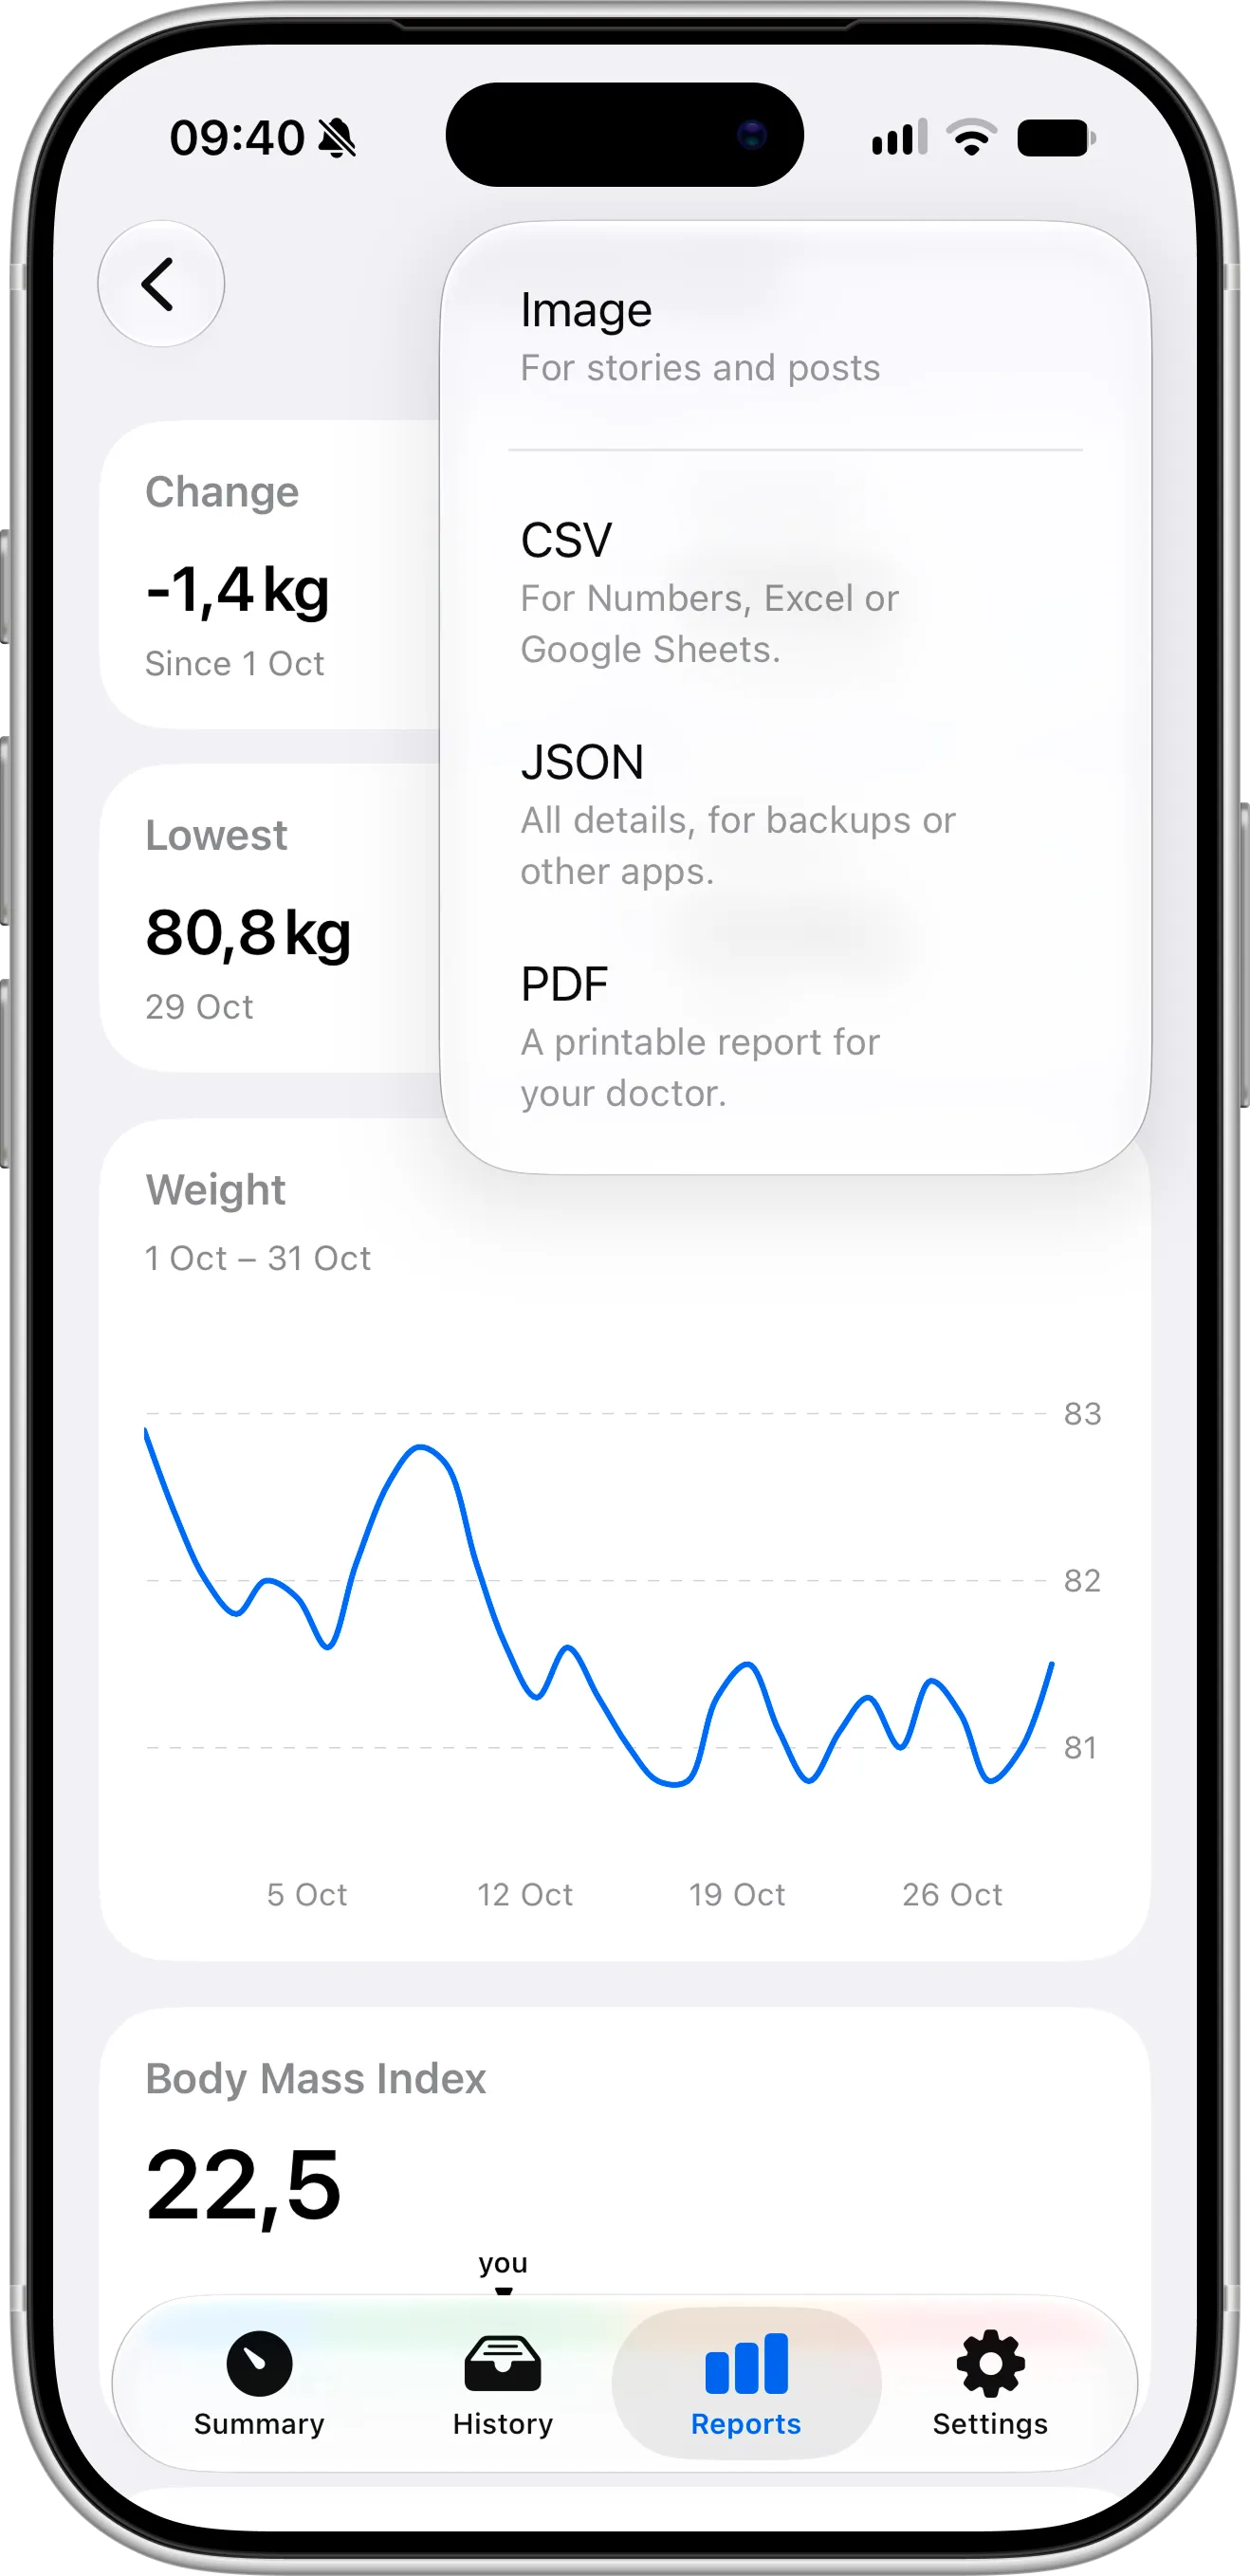
The share menu on a report: post your progress as an image, export the month’s weigh-ins or create a PDF for your doctor.
Tips for Getting the Most Out of Reports
Open your report when it’s ready at the start of each month. It’s a good moment to celebrate your progress and decide what to change next month. Compare months rather than single days: if this month’s change is smaller than last month’s, look at your weigh-in time and check-in days before changing your plan.
Try to log your weight every day. The more weigh-ins a report has, the more accurate your average, chart and weight distribution become.
Daily logging is easier when it only takes a few seconds. You can add a weigh-in with Siri, the Action button and Shortcuts or from Control Center, and keep an eye on your trend with Home Screen widgets.
Need Help or Have Feedback?
If you have questions about Reports or ideas for what you’d like to see in them, you can always reach out through the contact page. Your feedback helps improve the weight tracker experience for everyone.
